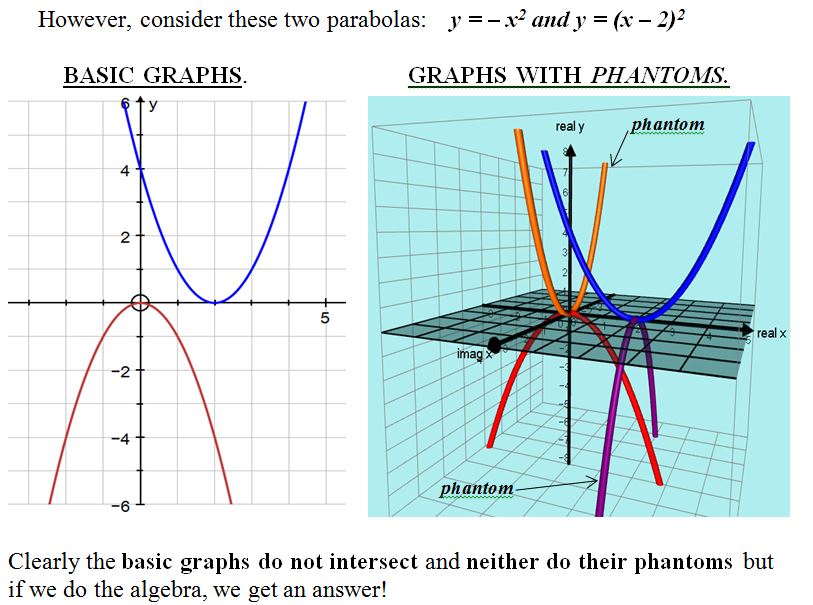
When this function y = f(x) = (x^2 + 1) is first
introduced, we learn its Graph to be a simple parabola.
THEN when we learn that x can be a complex number, so that
the Graph is 2 (orthogonally) linked Parabolas.
---------- like this:
https://phantomgraphs.weebly.com/uploads/5/4/5/4/5454288/4_4_orig.jpg
https://www.geogebra.org/resource/czbugz9h/fofRh3ZjmwwISd2v/material-czbugz9h-thumb@l.png
This graph is showing a smooth , curved surface -->
https://i.sstatic.net/soSJ8.png
What is this graph showing???
it purports to show f(x) = (x^2 + 1)
Op 29-7-2024 om 21:28 schreef HenHanna:
When this function y = f(x) = (x^2 + 1) is first
introduced, we learn its Graph to be a simple parabola.
THEN when we learn that x can be a complex number, so that
the Graph is 2 (orthogonally) linked Parabolas.
---------- like this:
https://phantomgraphs.weebly.com/uploads/5/4/5/4/5454288/4_4_orig.jpg
https://www.geogebra.org/resource/czbugz9h/fofRh3ZjmwwISd2v/material-czbugz9h-thumb@l.png
This graph is showing a smooth , curved surface -->
https://i.sstatic.net/soSJ8.png
What is this graph showing???
it purports to show f(x) = (x^2 + 1)
Some 3D graphs include the surfaces of Re(f(z)), Im(f(z)), Abs(f(z)),
where w=f(z), z=x+iy and w=u+iv. The graphs you mentioned are (part of)
one of these.*
The 'true' graph of the function is a fourdimensional surface in
(x,y,u,v) space. No mainstream math grapher whatsoever has even come to
think about trying to visualise complex functions as 4D surfaces. But I
have, since college. I've been using such tools as mm-paper with a programmable HP calculator, Amiga and Quick Basic, until I came across
the unpretentious Graphing Calculator 4.0 of Pacific Tech that came with
4D included in its standard package! And now I've tricksed Desmos3D and Geogebra as well into graphing 4D surfaces. All to be discovered in my webpages and YT channel.
https://www.wugi.be/qbComplex.html
https://www.wugi.be/qbinterac.html (Desmos and Geogebra examples,
ongoing and not up to date)*
https://www.youtube.com/@wugionyoutube/playlists (look for "4D" and
"Complex Function" playlists)
So, for your parabola, ie, w=z^2:
https://www.wugi.be/animgif/Parab.gif (QBasic) https://www.youtube.com/watch?v=wuviGuMTrTM&list=PL5xDSSE1qfb6Uh98_9vS4BEMEGJB2MZjs&index=2
https://www.youtube.com/watch?v=oIyGTf1ZKCI&list=PL5xDSSE1qfb6FIk0Pl3VCg5p3Ema52hEG&index=5
https://www.desmos.com/calculator/ijcs47qmaz?lang=nl (Desmos2D) https://www.geogebra.org/calculator/truptem5 (Geogebra) https://www.desmos.com/3d/q9vhspfqq7?lang=nl (Desmos3D example of w=cos
z, haven't done parabola yet)
*Another interesting family of 3D surfaces you won't encounter elsewhere
is that of "true curve" surfaces, ie curves belonging "as such" (courbes vraies = "telles quelles") to the 4D function surface. I've only this
year 'rediscovered' them (my first ever attempts were drawing 3D curves belonging to the 4D surfaces). See my Desmos page above for examples.
Feel free to explore, and welcome to the interested ;-)
On 7/29/2024 2:30 PM, guido wugi wrote:
Op 29-7-2024 om 21:28 schreef HenHanna:
When this function y = f(x) = (x^2 + 1) is first
introduced, we learn its Graph to be a simple parabola.
THEN when we learn that x can be a complex number, so that
the Graph is 2 (orthogonally) linked Parabolas.
---------- like this:
https://phantomgraphs.weebly.com/uploads/5/4/5/4/5454288/4_4_orig.jpg
https://www.geogebra.org/resource/czbugz9h/fofRh3ZjmwwISd2v/material-czbugz9h-thumb@l.png
This graph is showing a smooth , curved surface -->
https://i.sstatic.net/soSJ8.png
What is this graph showing???
it purports to show f(x) = (x^2 + 1)
Some 3D graphs include the surfaces of Re(f(z)), Im(f(z)), Abs(f(z)),
where w=f(z), z=x+iy and w=u+iv. The graphs you mentioned are (part
of) one of these.*
The 'true' graph of the function is a fourdimensional surface in
(x,y,u,v) space. No mainstream math grapher whatsoever has even come
to think about trying to visualise complex functions as 4D surfaces.
But I have, since college. I've been using such tools as mm-paper
with a programmable HP calculator, Amiga and Quick Basic, until I
came across the unpretentious Graphing Calculator 4.0 of Pacific Tech
that came with 4D included in its standard package! And now I've
tricksed Desmos3D and Geogebra as well into graphing 4D surfaces. All
to be discovered in my webpages and YT channel.
https://www.wugi.be/qbComplex.html
https://www.wugi.be/qbinterac.html (Desmos and Geogebra examples,
ongoing and not up to date)*
https://www.youtube.com/@wugionyoutube/playlists (look for "4D" and
"Complex Function" playlists)
So, for your parabola, ie, w=z^2:
https://www.wugi.be/animgif/Parab.gif (QBasic)
https://www.youtube.com/watch?v=wuviGuMTrTM&list=PL5xDSSE1qfb6Uh98_9vS4BEMEGJB2MZjs&index=2
https://www.youtube.com/watch?v=oIyGTf1ZKCI&list=PL5xDSSE1qfb6FIk0Pl3VCg5p3Ema52hEG&index=5
https://www.desmos.com/calculator/ijcs47qmaz?lang=nl (Desmos2D)
https://www.geogebra.org/calculator/truptem5 (Geogebra)
https://www.desmos.com/3d/q9vhspfqq7?lang=nl (Desmos3D example of
w=cos z, haven't done parabola yet)
*Another interesting family of 3D surfaces you won't encounter
elsewhere is that of "true curve" surfaces, ie curves belonging "as
such" (courbes vraies = "telles quelles") to the 4D function surface.
I've only this year 'rediscovered' them (my first ever attempts were
drawing 3D curves belonging to the 4D surfaces). See my Desmos page
above for examples.
Feel free to explore, and welcome to the interested ;-)
thanks! i think i thought about this when i was younger... Haven't thought about it for 30+ years.
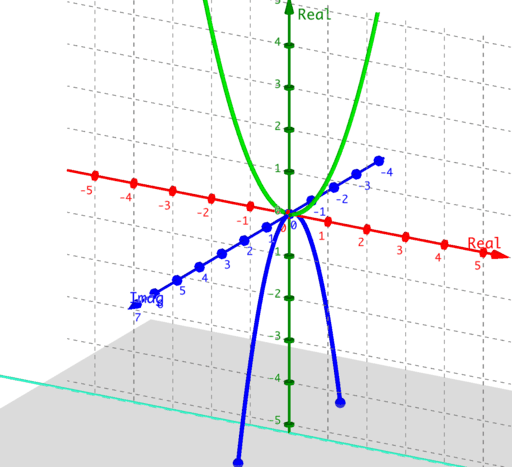
Graph of Y= X^2 ( where X=a+bi )
Y= X^2 has no imaginary part only when a=0 or b=0.
For this clip (below, the 2nd half "animate..." ),
are you just ignoring the imaginary part of Y ?
Is your surface the same as this one? https://s3-us-west-2.amazonaws.com/courses-images/wp-content/uploads/sites/5667/2021/09/23134416/4-7-3.jpeg
https://www.youtube.com/watch?v=oIyGTf1ZKCI
Visualization of Complex Functions: the Parabola Y = X ^ 2
When this function y = f(x) = (x^2 + 1) is first
introduced, we learn its Graph to be a simple parabola.
THEN when we learn that x can be a complex number, so that
the Graph is 2 (orthogonally) linked Parabolas.
---------- like this:
https://phantomgraphs.weebly.com/uploads/5/4/5/4/5454288/4_4_orig.jpg
https://www.geogebra.org/resource/czbugz9h/fofRh3ZjmwwISd2v/material-czbugz9h-thumb@l.png
This graph is showing a smooth , curved surface -->
https://i.sstatic.net/soSJ8.png
What is this graph showing???
it purports to show f(x) = (x^2 + 1)
| Sysop: | Keyop |
|---|---|
| Location: | Huddersfield, West Yorkshire, UK |
| Users: | 498 |
| Nodes: | 16 (2 / 14) |
| Uptime: | 33:29:22 |
| Calls: | 9,798 |
| Files: | 13,751 |
| Messages: | 6,189,096 |